www.maorpet.com
Imaging - Principle of wave field extrapolation (cont)
First of all, we are lazy. Second, we do not have enough spades and men force to do the digging.


Instead, we apply some mathematics. We will compute, what could the receivers record at dz, 2*dz, ... etc. depth, in case we made the digging. Also, instead of digging, we send down a wave to check the circumstances of our receivers. The original wave, which generated our reflected, and registered wave field started from the source point location at the surface. We will introduce an artificial signal and we will push it down from the surface to dz, 2*dz, ... etc depth levels. We do it exactly the same way, as we do for the recorded traces, except that the recorded traces contained waves, which were coming up, while the source wave must go down. Never mind; it is only a question of a sign. You will see the mathematics soon enough.
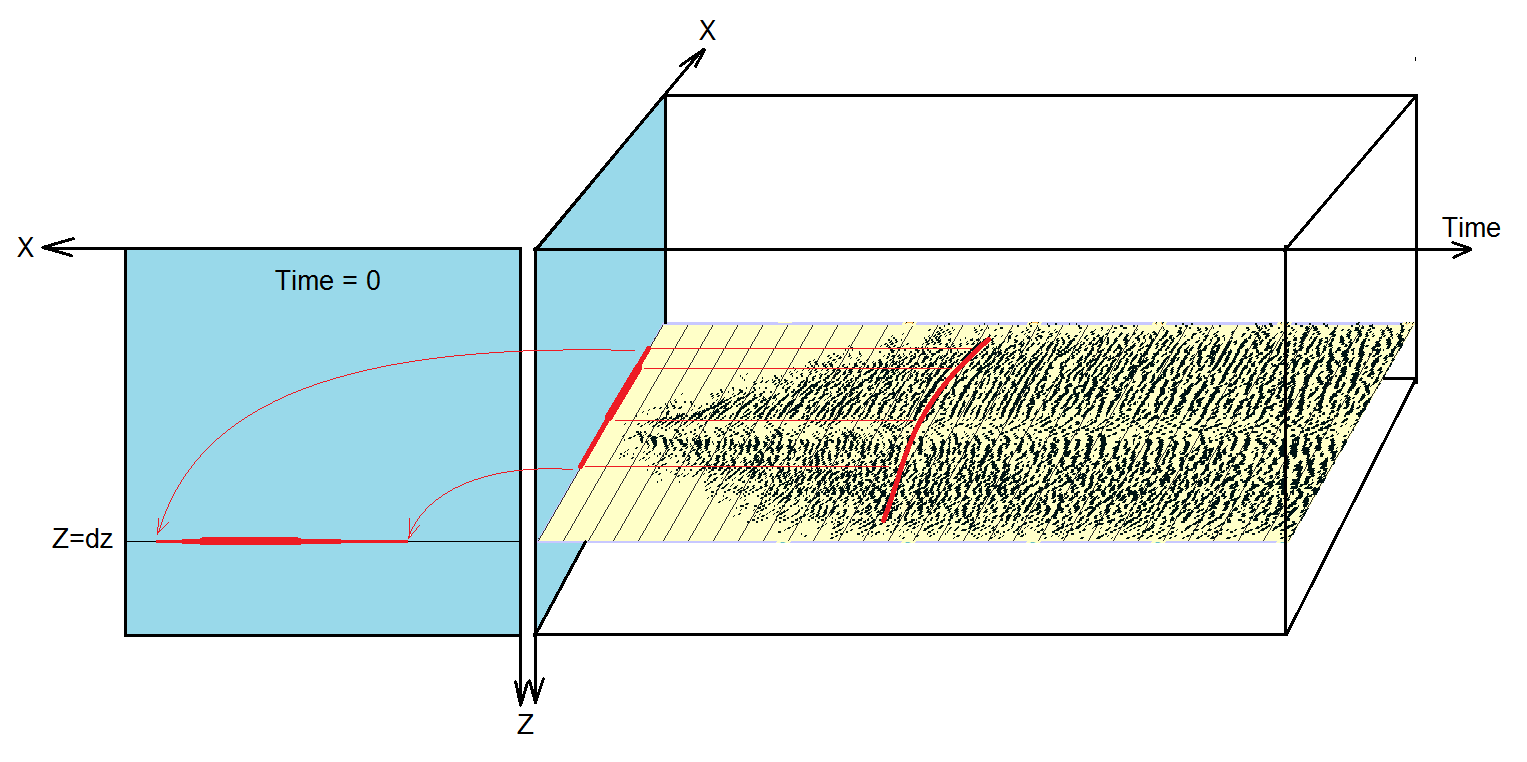
What you see on the picture above; the receivers had been pushed down to the dz depth. This would be the recorded image, had we really dig down our geophones. The red curve shows the shape of our artificial wave. This is how the wave looks like when it arrives to the dz depth level.
Now, the imaging: Try to study the picture above. It has the wave field, what we could have recorded at the z = dz depth (in yellow) and it also shows the source wave, what we forced down to the z = dz depth (in red).
In case we had a reflector at the dz depth, the down-going source wavelet and the reflected receiver wavelet must be in coincidence. We simply cross correlate the two waves, and we take the zero shift element of the cross correlation. We do this for all recorded traces; it means, for all existing (x, z=dz) positions we will have one data sample. We normalize the zero shift member of the cross correlation so, that it will show the ratio between the receiver amplitude versus the artificial source wave amplitude. So, the data samples will give us the reflection coefficients.
We place these data elements on the P(x, z, t=0) plane at the x=xi, z=dz, t=0 position. This are the red dots on the blue plane in the picture. This is what we call: imaging
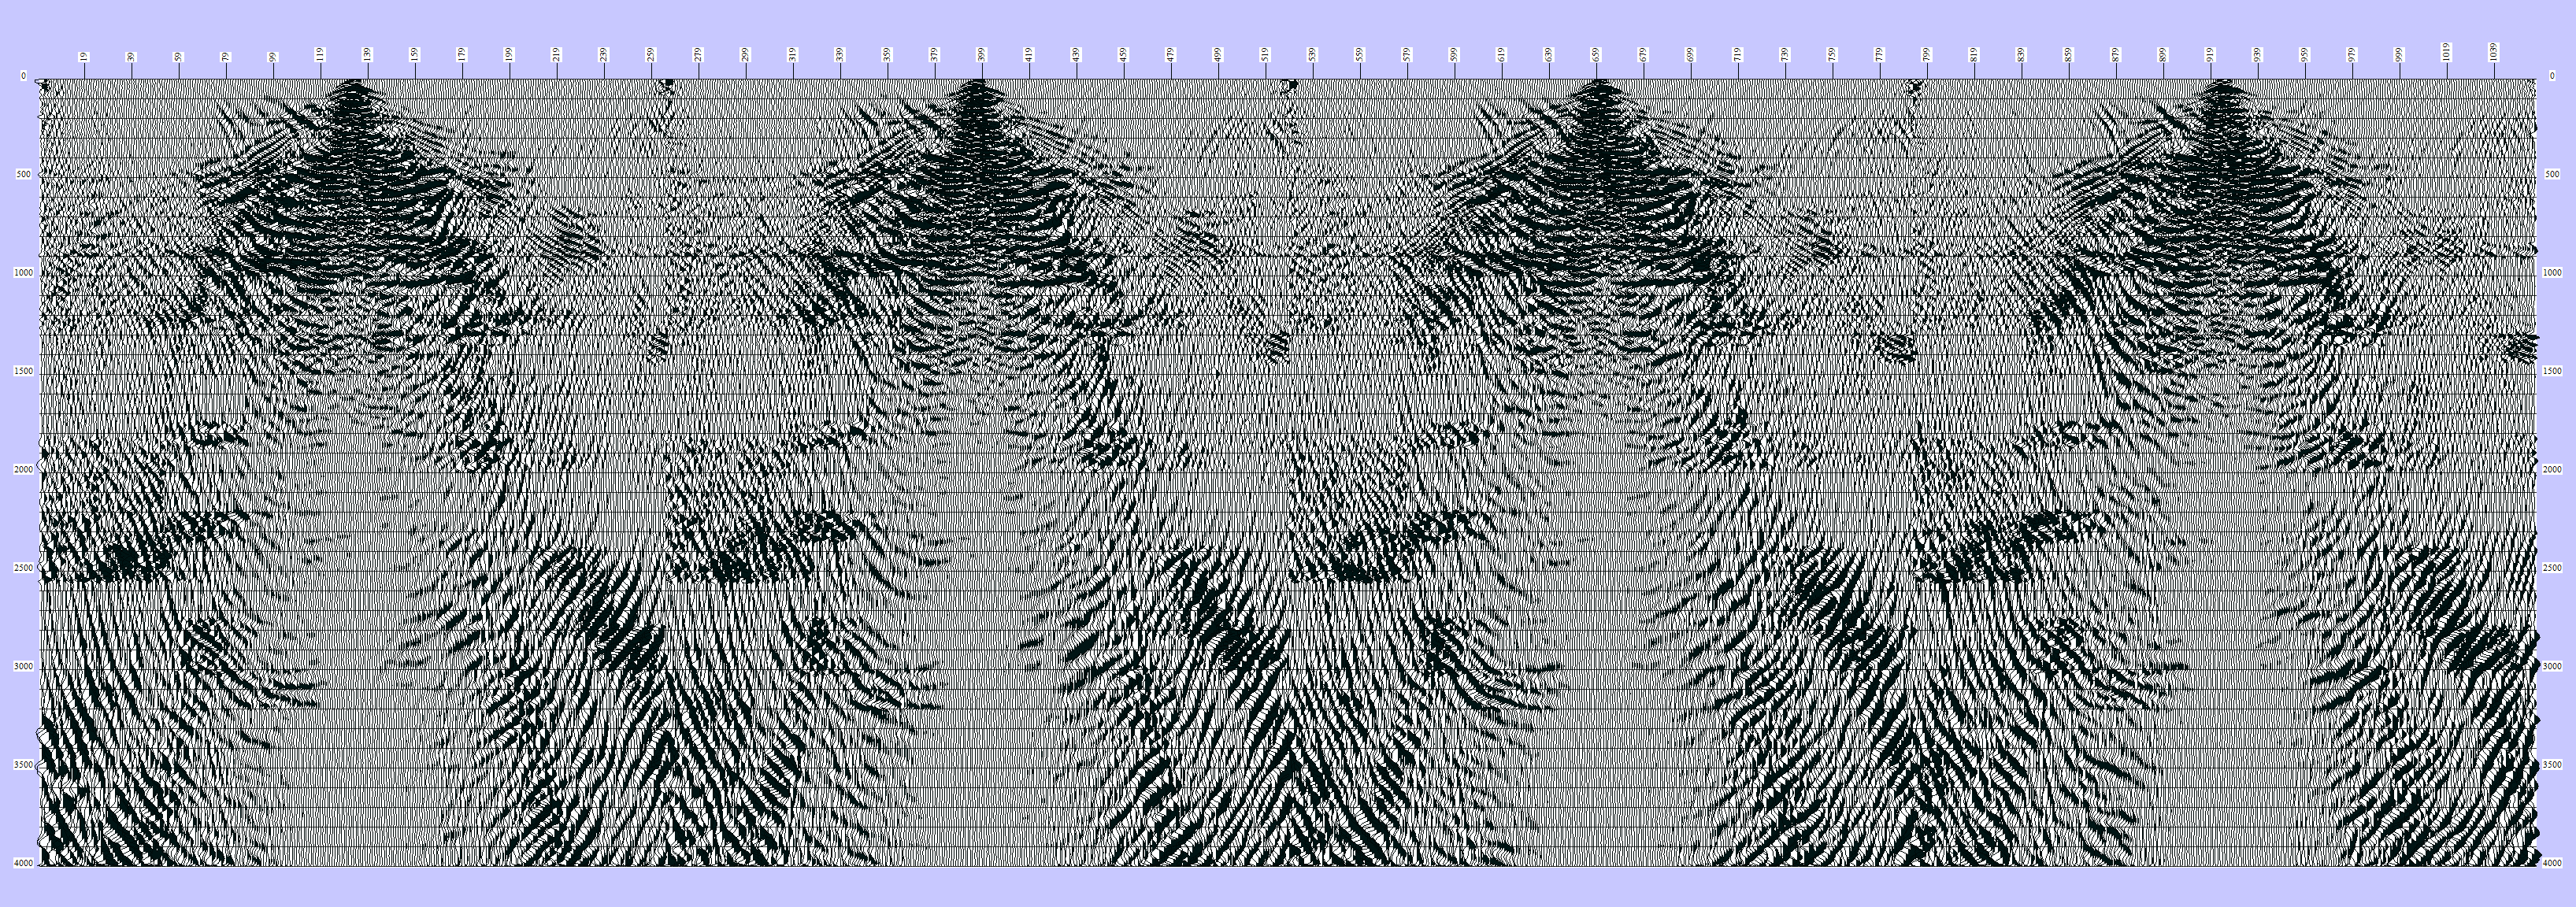
On the following pictures you can see some examples of this imaging process. The final result comes from summing together the traces from the same receiver positions. You will see it later on. Now do some mathematics.


...